Top 10 Stocks in the S&P 500: How Often Do The Leaders Change?

The S&P 500 index is considered to be one of the most prominent stock indexes within the financial community and is often used as a benchmark for performance comparisons. It represents the largest companies in the U.S. stock market and as the name suggests the index consists of about 500 underlying companies.
The index has a market capitalization weighted calculation methodology. This simply means that the largest companies, which are ranked by highest market cap, are assigned a larger allocation percentage within the index. Therefore, the largest companies have a significantly higher impact on the index’s price movements as compared to the smaller companies. The S&P 500’s index methodology is often described as a “self-healing” process as the rules automatically manage and adjust the allocation percentage up or down connected to how a company is performing; better performance = higher market cap = larger allocation percentage in the index.
Concentration Remains Near All-time Highs
Since the largest, and by connection arguably the most successful, companies make up a considerable portion of the index it would be interesting to see how these trends change over time.
One question that is often asked is how concentrated is the S&P 500 index? We can assess this by looking at the top 10 index weights over time. The example below looks at quarterly data and shows the trend of the index weights over the past 10 years. 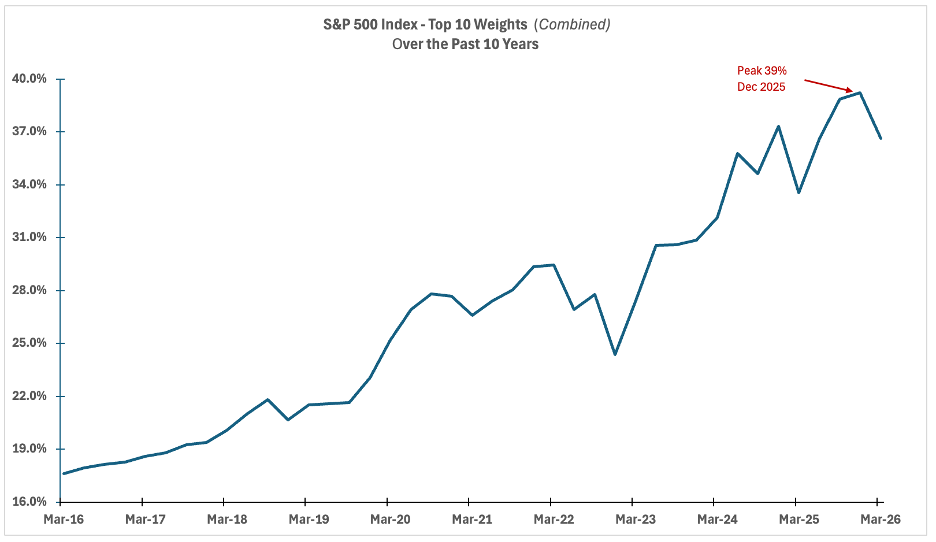
It is no doubt, that the index is significantly more concentrated today than 10 years ago, with the trend peaking at 39% this past December. While a higher concentration can be concerning and something to monitor, the current top companies are continuing to produce robust earnings growth and are maintaining healthy profit margins. If this were to change, then this could potentially be troublesome. However, as we mentioned before if one company were to start to drastically underperform, then this could lead to another company assuming its place in the top 10.
How Often Do the Top Companies Change
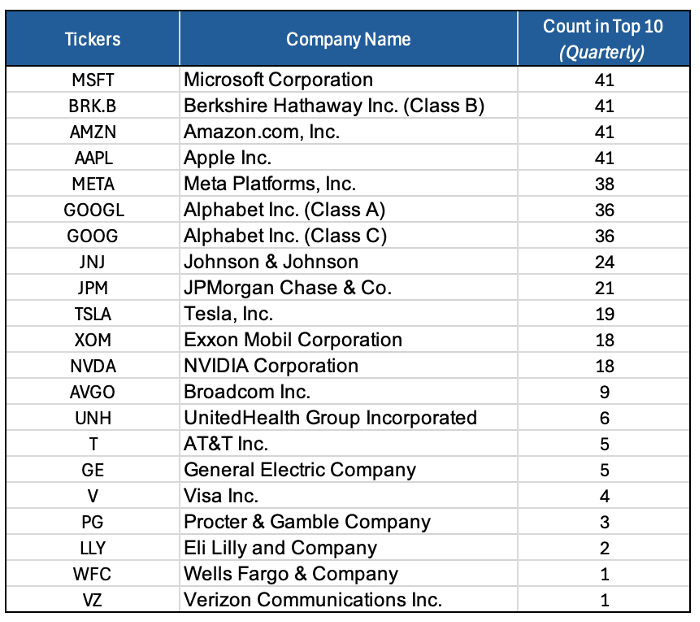
Looking at the same quarterly data, we can look to see how frequently the top 10 leaders change in the S&P 500. If we glance at the list below, there are several companies that have appeared in the index’s top 10 every quarter; there are 41 quarters in this sample set. Some people might be able to guess offhand a few of these companies as they are household names such as Apple, Berkshire Hathaway, Microsoft, and Amazon.
Other well known companies such as Google, Meta (formerly Facebook) have appeared 36 or more times in the top 10. Overall, most of the stock tickers should be recognizable in the list even the companies who only appeared 1-5 times: Verizon, Wells Fargo, Eli Lilly, Procter & Gamble, Visa, General Electric, AT&T.
Looking at the quarterly data presented differently we can see each year a company appeared in the top 10. This is represented by a highlighted green cell with a “X” in the table below. The list of companies that ranked in the top 10 does not look drastically different in 2016 than it does today outside a few differences.
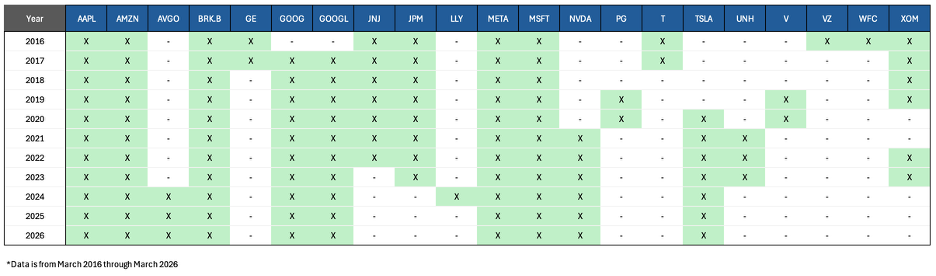
In general, this data analysis shows that once a company reaches “top 10 status” in the index it is uncommon for it to leave that prestigious group. However, it is not completely impervious from being kicked out by another rising star.
Do you have questions about the S&P 500 and how they can work in your portfolio? Reach out to schedule a complimentary consultation today!
Andrew Pratt, CFA, CBDA
Investment Manager, Wiser Wealth Management


Share This Story, Choose Your Platform!
Wiser Wealth Management, Inc (“Wiser Wealth”) is a registered investment adviser with the U.S. Securities and Exchange Commission (SEC). As a registered investment adviser, Wiser Wealth and its employees are subject to various rules, filings, and requirements. You can visit the SEC’s website here to obtain further information on our firm or investment adviser’s registration.
Wiser Wealth’s website provides general information regarding our business along with access to additional investment related information, various financial calculators, and external / third party links. Material presented on this website is believed to be from reliable sources and is meant for informational purposes only. Wiser Wealth does not endorse or accept responsibility for the content of any third-party website and is not affiliated with any third-party website or social media page. Wiser Wealth does not expressly or implicitly adopt or endorse any of the expressions, opinions or content posted by third party websites or on social media pages. While Wiser Wealth uses reasonable efforts to obtain information from sources it believes to be reliable, we make no representation that the information or opinions contained in our publications are accurate, reliable, or complete.
To the extent that you utilize any financial calculators or links in our website, you acknowledge and understand that the information provided to you should not be construed as personal investment advice from Wiser Wealth or any of its investment professionals. Advice provided by Wiser Wealth is given only within the context of our contractual agreement with the client. Wiser Wealth does not offer legal, accounting or tax advice. Consult your own attorney, accountant, and other professionals for these services.