Ways to Predict the Stock Market

There are specific ways technical analysts predict stock market performance, whether or not they are actually successful is the question. From measuring hemlines to buying high and selling low, these methods are certainly unique strategies for beating the market. This blog is a part of a series written by our summer intern, Makenna. This series is based off excerpts from the well-known book, A Random Walk Down Wall Street.
The Hemline Indicator
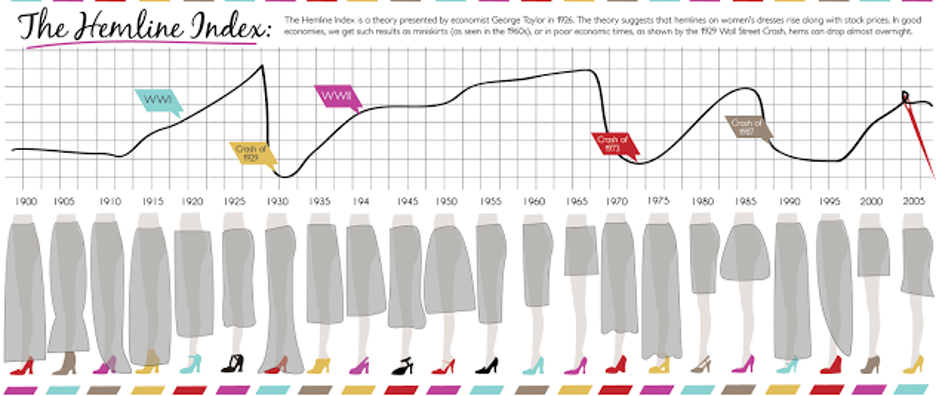
Technical analysts argue that the current stylish length for women’s pants indicates stock market performance, this is referred to as the Hemline Indicator. A shorter hem means financial success while a longer hem means financial decline. Over the past 100 years, there seems to be evidence that the hemline indicator is an accurate way to predict financial performance. For instance, the graph below shows 1930 and 1975 as significant dips in the market as well as significantly longer hemlines for those years. However, this relationship seems to be a simple correlation rather than a causation since the fashion choices of women and stock market performance are unrelated. In addition, while there is a correlation historically, women no longer have a socially determined hemline like the early 1900s. Vogue once said “…you can now dress like a man or woman, and all hemlines are now okay.” This means that even if it was a successful indicator from the past, the hemline indicator is now insignificant.
The Super Bowl Indicator
Another stock market coincidence is the correlation between market performance and the winning Super Bowl team. Some technical analysts believe that when an original team from the National Football League wins the Super Bowl, the market will be bullish. On the other hand, when an original team from the American Football League wins the Super Bowl, the market will be bearish. While this indicator isn’t perfectly historically accurate, more often than not it accurately forecasted market performance. For instance, from 2000 to 2016, the Super Bowl Indicator correctly predicted stock market increases and decreases twelve out of the seventeen years for a 70% accuracy rate. However, this method is likely illogical and shows a coincidental correlation between unrelated factors.
The Odd-Lot Theory
The Odd-Lot method of investing argues that the best way to ensure growth is to buy and sell against an odd-lotter. An odd-lotter is someone who does not invest the usual round lot of 100 shares, and is therefore expected to perform worse than those who invest a round lot of shares. Using this theory, a technical analyst would buy when the odd-lotter sells and sell when the odd-lotter buys. Unfortunately, this theory is hardly based on evidence. Odd-lotters might perform slightly worse than average, but evidence suggests that an odd-lotter’s purchases and sales are not accurate indicators of market performance.
Dogs of the Dow
Another method of investing, the Dogs of the Dow theory, contradicts the usual “buy low, sell high” mentality. Using this strategy, technical analysts would purchase the ten stocks that had the highest dividends and were the most favored according to the Dow Jones 30-Stock Industrial Average. The expectation was that those ten stocks would increase in value in the future and therefore produce a large profit. A man named James O’Shaughnessy tested the Dogs of the Dow theory starting in the 1920s and found that it had “beaten the overall index by over 2 percentage points per year with no additional risk.” Because of O’Shaughnessy’s research, billions of dollars were spent following this theory which actually caused the theory to implode on itself. From that point on, the Dogs of the Dow actually underperformed the market.
While each of these methods seemed to have coincidentally proven when the stock market fluctuated in the past, they are simply coincidences and nothing more. Especially when speculating long-term growth, technical analysis is not any more successful than a buy and hold strategy. The lesson from these unique technical analysis methods is that correlation does not imply causation.
Makenna Cooper
Summer Intern / Berry College Student


Share This Story, Choose Your Platform!
Wiser Wealth Management, Inc (“Wiser Wealth”) is a registered investment adviser with the U.S. Securities and Exchange Commission (SEC). As a registered investment adviser, Wiser Wealth and its employees are subject to various rules, filings, and requirements. You can visit the SEC’s website here to obtain further information on our firm or investment adviser’s registration.
Wiser Wealth’s website provides general information regarding our business along with access to additional investment related information, various financial calculators, and external / third party links. Material presented on this website is believed to be from reliable sources and is meant for informational purposes only. Wiser Wealth does not endorse or accept responsibility for the content of any third-party website and is not affiliated with any third-party website or social media page. Wiser Wealth does not expressly or implicitly adopt or endorse any of the expressions, opinions or content posted by third party websites or on social media pages. While Wiser Wealth uses reasonable efforts to obtain information from sources it believes to be reliable, we make no representation that the information or opinions contained in our publications are accurate, reliable, or complete.
To the extent that you utilize any financial calculators or links in our website, you acknowledge and understand that the information provided to you should not be construed as personal investment advice from Wiser Wealth or any of its investment professionals. Advice provided by Wiser Wealth is given only within the context of our contractual agreement with the client. Wiser Wealth does not offer legal, accounting or tax advice. Consult your own attorney, accountant, and other professionals for these services.